


Visualising Code Behaviour
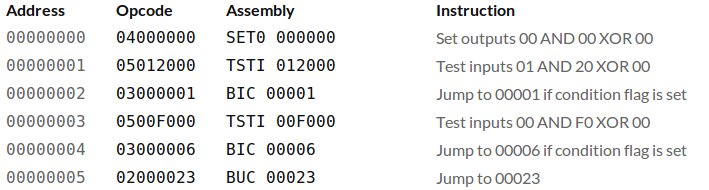
I will be designing and implementing a micro-controller as part of my University studies, and one of the optional activities that the course professor suggested would be to write a disassembler for it. The micro-controller uses a toy instruction-set capable of some primitive logic and IO operations, and my approach to writing the disassembler was to put together a minimal parser in JavaScript to decode the opcodes and arguments from a list of instructions, and output an address, mnemonic instruction name and human-readable description:
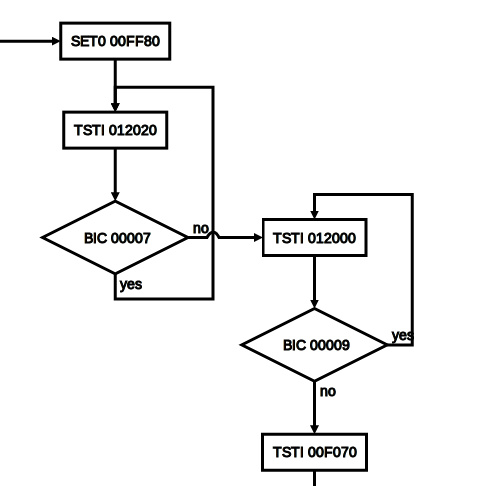
The next logical step after disassembling the what of the code was to investigate the why of the code. For this, we need a way of visualising the flow of the program. For this, I turned to the incredibly aptly named flowchart.js, which allowed to me to very simply turn the linear list of instructions to a true branching graph:
The source code which implements it clocks in at under 200 lines of code, and one of the reasons for this extreme brevity is the simplicity of the instruction set, with a whopping six operations:
| Opcode | Instruction | Description |
| 00 | IUC | Increment unconditionally |
| 01 | HUC | Halt unconditionally |
| 02 | BUC <address> | Branch unconditionally |
| 03 | BIC <address> | Branch conditionally |
| 04 | SETO <port> <and> <xor> | Set outputs |
| 05 | TSTI <port> <and> <xor> | Test inputs |
The disassembler and code visualiser are packaged into an interactive web application here: